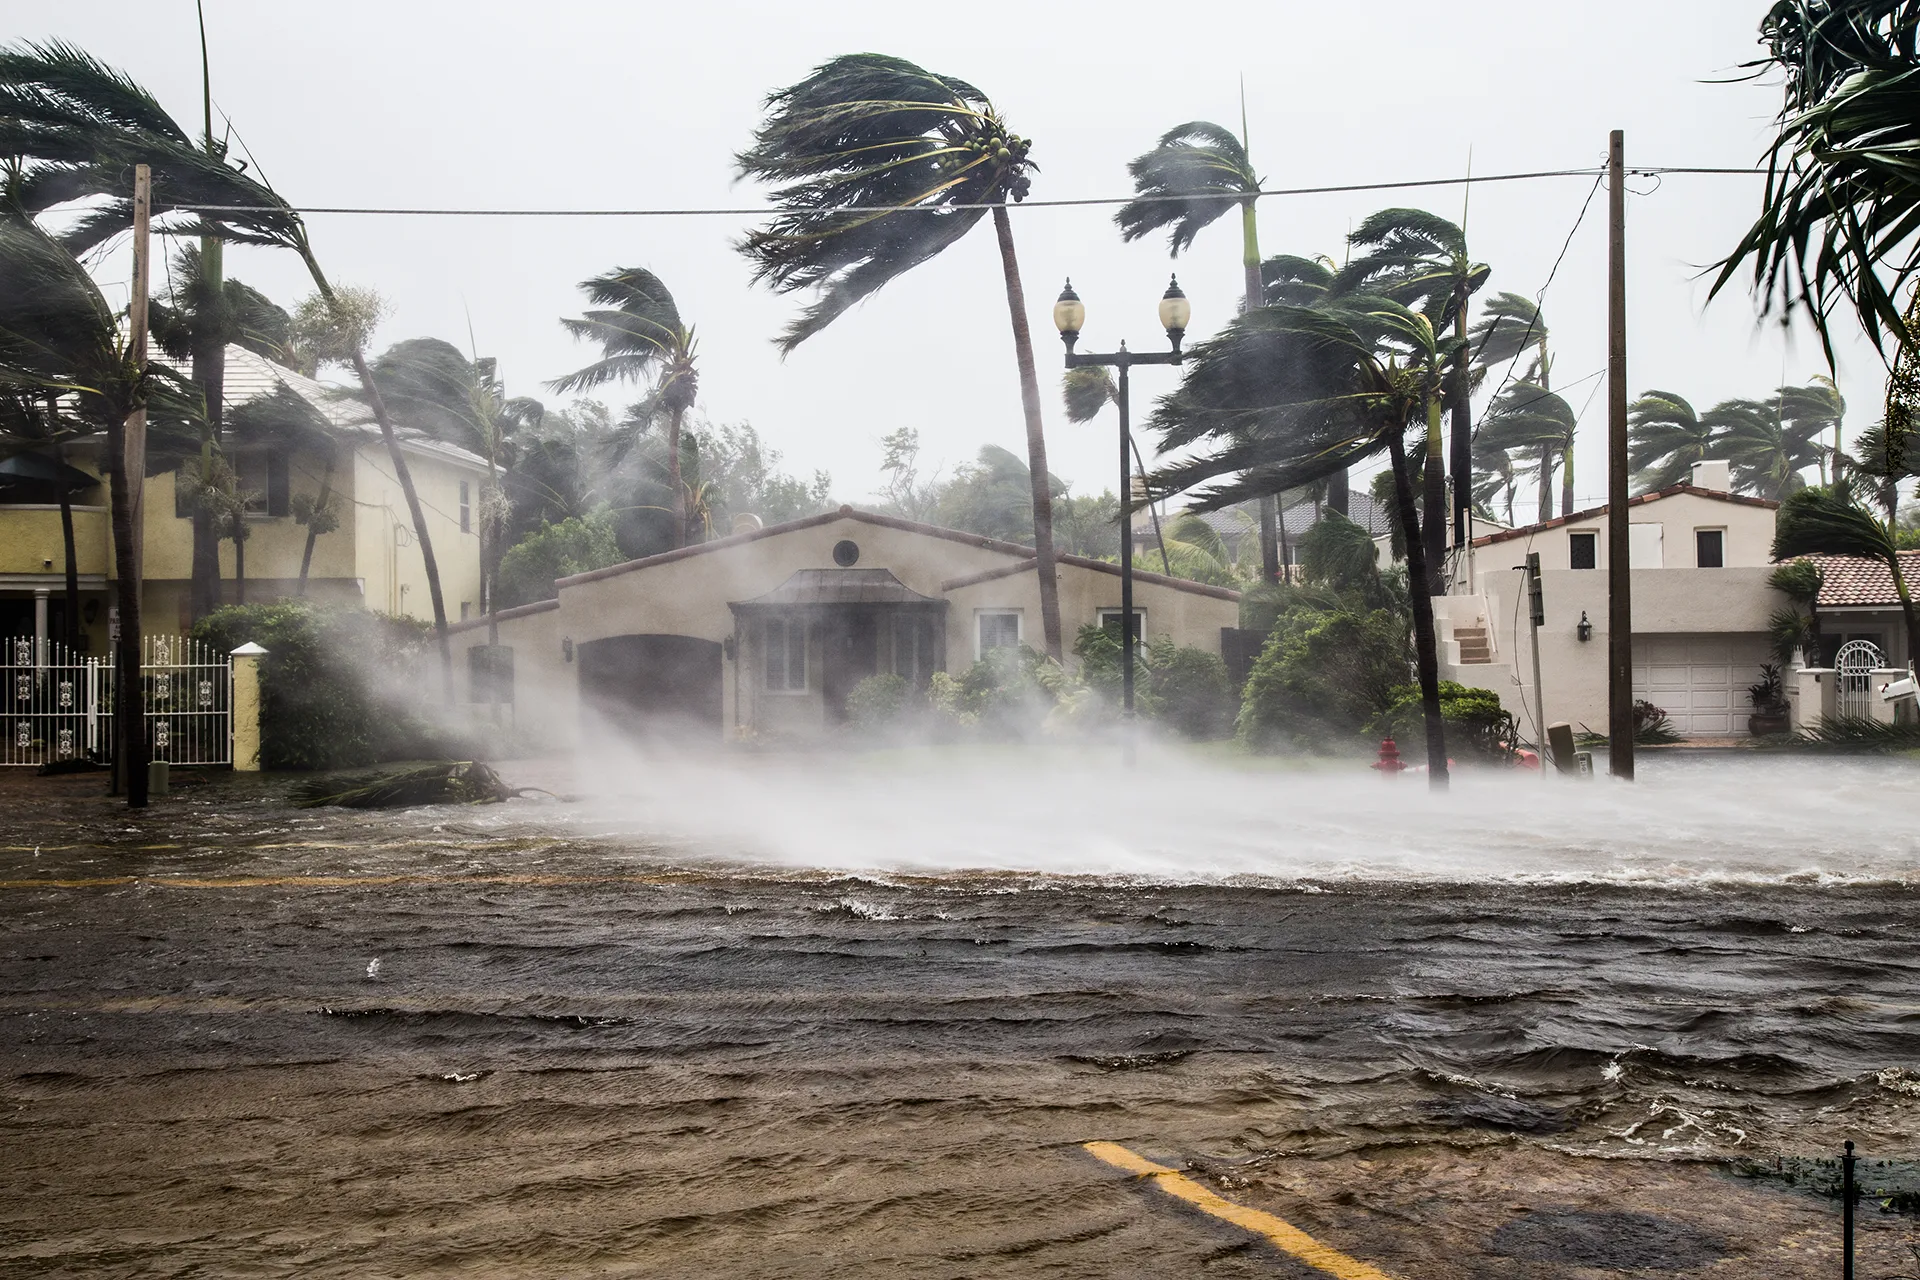
How Often Does It Flood in San Antonio?
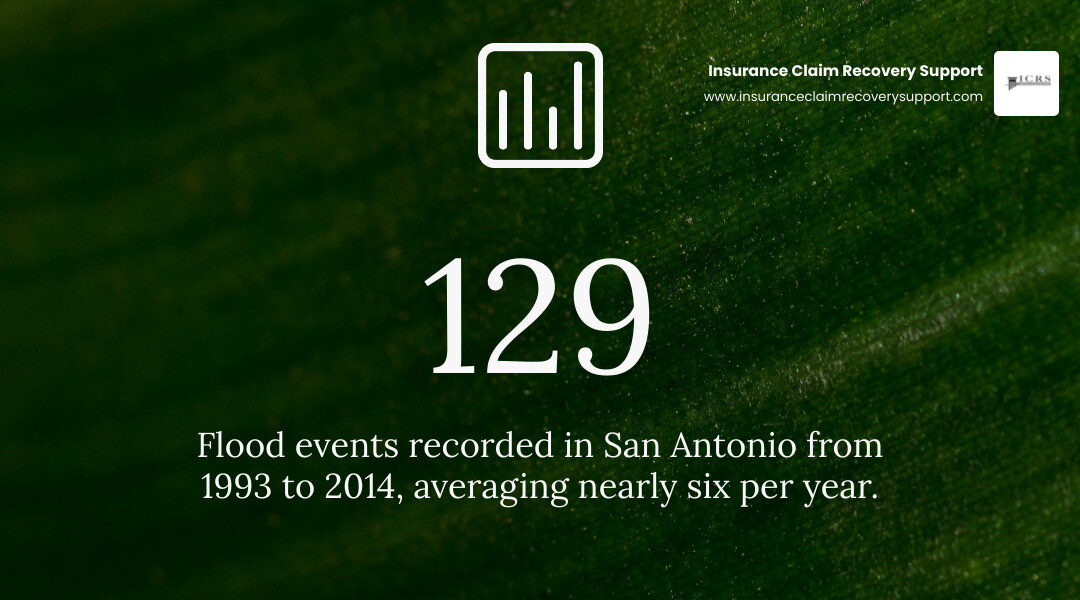
How often does it flood in San Antonio? City historical records list 129 flood events from 1993 through 2014, an average of nearly six per year. That does not mean every property floods six times a year: flash floods can be highly localized, and some storms are far more damaging than others.
For commercial buildings and multifamily properties, the useful question is where water could reach the site, how quickly it could arrive, and whether the property has coverage for the resulting loss. San Antonio’s rapid runoff and sharp swings between dry weather and intense rain make those questions worth answering before the next storm.
How often does it flood in san antonio terms to learn:
How Often Does It Flood in San Antonio? Historical Data and Risk Metrics
To truly understand how often flooding occurs across Bexar County, look at federal risk assessments alongside local incident history. According to FEMA’s National Risk Index (NRI), San Antonio carries a riverine flood risk score of 99.7 out of 100—placing it in the “Very High” risk category and ranking it 8th among all major U.S. metropolitan areas. Federal data models calculate an annualized rate of 7.46 flood events per year across the metro area.
These statistics align with historical data collected across decades of Texas flood events. Between 1993 and 2014 alone, the National Climatic Data Center recorded 129 distinct flood occurrences in San Antonio. These storms resulted in 16 fatalities, 507 injuries, and tens of millions of dollars in structural damage.
How Often Does It Flood in San Antonio by Season and Month?
Flooding in Central Texas is distinctly seasonal, marked by intense precipitation spikes rather than evenly distributed monthly rainfall. Understanding the calendar helps property managers and building owners anticipate peak threat windows:
- Spring Peaks (April – June): May is historically the most flood-prone month in South-Central Texas, averaging over 22 National Weather Service flash flood reports regionally. Late spring storms often stall along local frontal boundaries, dropping extreme rain in narrow corridors.
- Mid-Summer Volatility (July – August): While high pressure often brings hot, dry conditions, summer downpours can still produce catastrophic flash flooding. In late summer, tropical disturbances moving inland from the Gulf of Mexico bring sudden, high-volume deluges.
- Autumn Secondary Peak (September – October): Early fall introduces strong cold fronts that collide with lingering tropical moisture. October historically hosts some of the region’s most damaging floods.
Evaluating How Often Does It Flood in San Antonio River Basins and Floodplains
San Antonio is traversed by major drainage networks, including the San Antonio River, Salado Creek, Leon Creek, and Medina River basins. Properties situated along these corridors face significant exposure when heavy rains exceed channel capacity.
However, flood risk is not limited to areas directly adjacent to waterways. A substantial portion of flood damage occurs in FEMA Zone X—designated as moderate-to-low risk. Over a standard 30-year mortgage or commercial financing term, properties in moderate flood zones carry a 26 percent statistical chance of experiencing flood inundation. When severe cloudbursts overwhelm municipal storm sewers, overland sheet flow causes severe property damage far outside mapped Special Flood Hazard Areas. In these situations, navigating San Antonio large property claims requires precise documentation of water entry points and structural impact.
Why San Antonio Is Geologically Built for Flash Flooding
San Antonio’s severe flood profile is a direct product of its natural geology and geographic setting. The city sits squarely in what hydrologists term “Flash Flood Alley”—one of the most flash-flood-prone land regions in North America.
The Geography of Flash Flood Alley
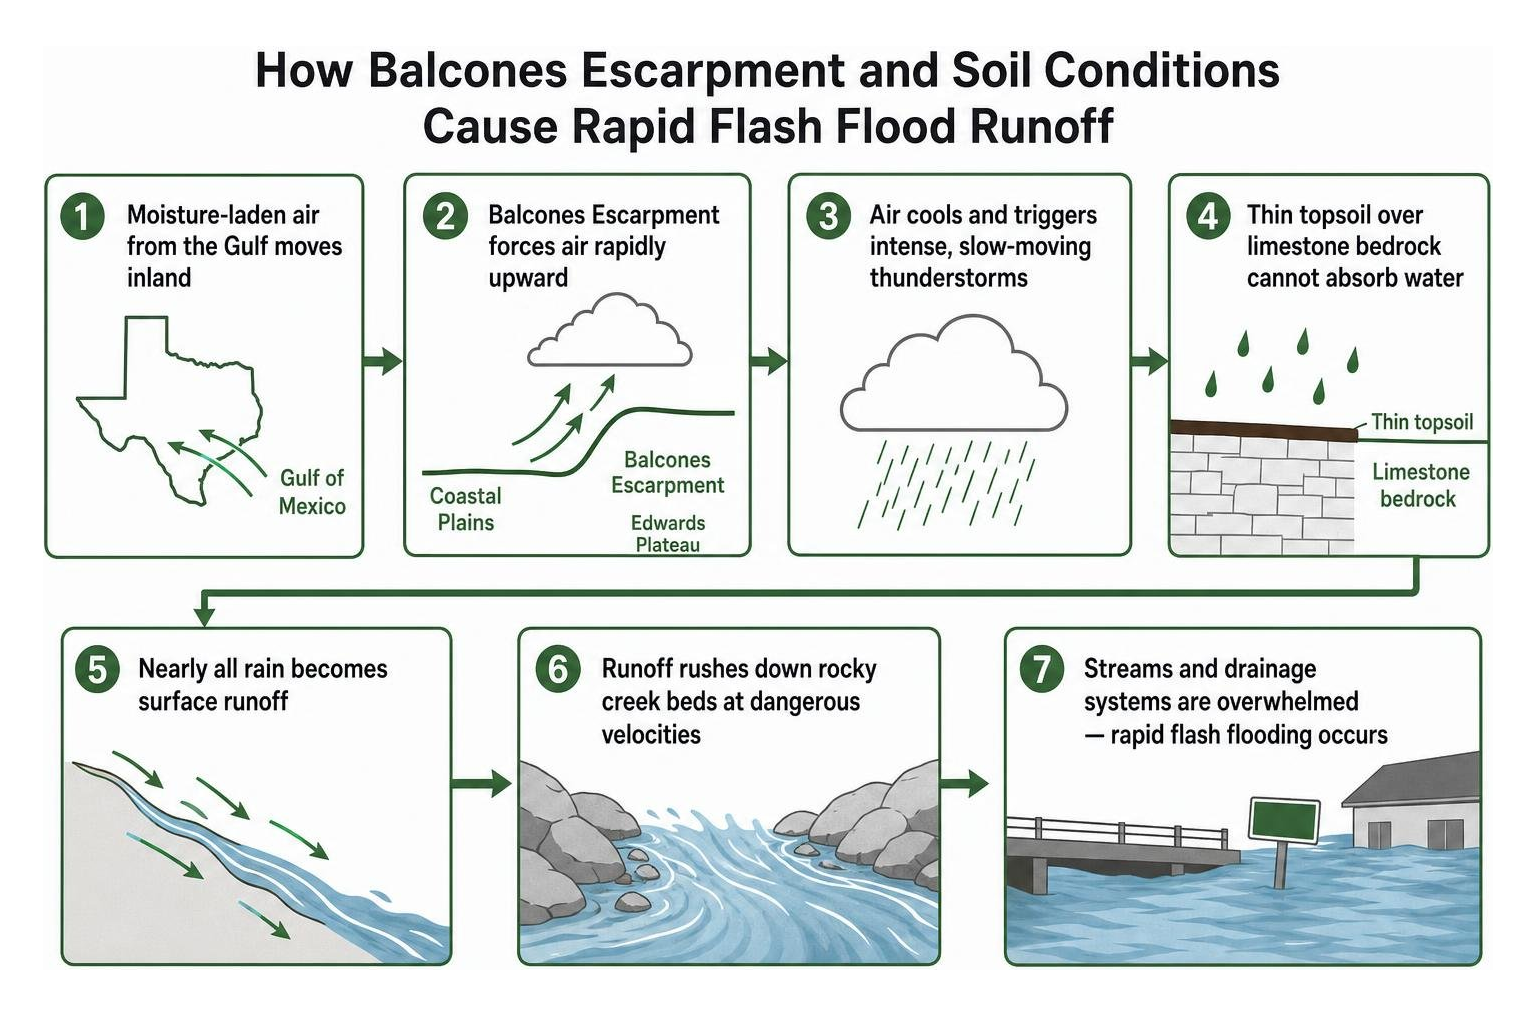
The primary geological driver is the Balcones Escarpment, a steep fault line zone where flat coastal plains abruptly meet the rising hills of the Edwards Plateau. When warm, moisture-laden air masses push inland from the Gulf of Mexico, the escarpment forces them rapidly upward. This orographic lift cools the air, triggering intense, slow-moving thunderstorms that drop immense volumes of water in very short periods.
Compounding this dynamic is the local ground structure. The Hill Country and upper Bexar County feature thin topsoil resting on solid, impermeable limestone bedrock. Because the earth cannot absorb moisture quickly, nearly all precipitation instantly becomes surface runoff, rushing down rocky creek beds at dangerous velocities. Extended drought conditions worsen this effect: parched soil turns hydrophobic, causing sudden downpours to roll off the surface like concrete.
Urbanization and Runoff Acceleration
As San Antonio has grown northward and westward, vast expanses of natural terrain have been paved over with asphalt, commercial roofs, and concrete parking lots. High-density commercial corridors—such as those along Loop 410, Loop 1604, and Interstate 10—create immense volumes of stormwater that surge into channelized creeks.
When upstream runoff meets dense urban infrastructure, stormwater drainage networks can become overwhelmed in minutes. This turns major thoroughfares, retail plazas, and ground-level structures into unintended drainage paths, elevating risks for weather damage insurance claims.
Notable San Antonio Floods and Lessons for Commercial Property Owners
San Antonio’s history is marked by recurrent, high-impact flood disasters that reshaped city infrastructure and building safety standards.
| Flood Event Date | Peak Rainfall Recorded | Fatalities | Notable Structural / Economic Impact |
|---|---|---|---|
| September 9–10, 1921 | 17.0+ inches regionally | 224+ | Downtown submerged under 10 ft of water; prompted construction of Olmos Dam |
| October 17–18, 1998 | 10.63 in (Airport), up to 19 in | 11 | $115M+ in property damage; 461 people rescued from high water |
| May 25, 2013 | 9.87 in (24-hr record), 17 in (5-hr gauge) | 2 | 350+ homes damaged, 15 destroyed; massive commercial road closures |
| June 12 & Aug 31, 2025 | 6.11 in (single day), 3.9 in / hr rate | 15 | Deadliest year in 27 years; 13 killed in single-day June 12 flash flood event |
The 1998 and 2013 Historic Deluges
The “Great Flood” of October 1998 remains a benchmark event for modern emergency management. The storm dumped over 10 inches of rain at the San Antonio International Airport in just a few hours, with regional gauges measuring up to 19 inches. Emergency responders conducted 192 water rescues, saving 461 people as floodwaters caused more than $115 million in structural damage across Bexar County.
In May 2013, another catastrophic storm hit the city, dumping 9.87 inches of rain at the airport within 24 hours and up to 17 inches across localized gauges within five hours. The flood destroyed 15 homes, damaged over 350 properties, and caused severe business disruptions along major creek crossings.
The 2025 Flash Floods: Modern Vulnerabilities Exposed
The year 2025 served as a stark reminder that modern stormwater systems cannot fully eliminate flash flood dangers. The city suffered its deadliest flood season in 27 years, with 15 deaths resulting from fast-moving storms. On June 12, 2025, 13 people lost their lives in a single morning as sudden downpours inundated roads and properties before warning systems could clear low-lying transit paths.
Remarkably, 75 percent of San Antonio’s entire summer rainfall in 2025 fell on just two specific days (June 12 and August 31), highlighting how concentrated, extreme rainfall events continue to test commercial properties and regional infrastructure. Reviewing the impact of the Texas floods of 2025 provides crucial context on how rapid-onset deluges impact commercial and multifamily facilities.
Flood Control Infrastructure and Warning Systems in Bexar County
Following the devastating 1921 downtown disaster, San Antonio pioneered regional flood-control engineering that continues to evolve today.
Citywide Engineering and Structural Safeguards
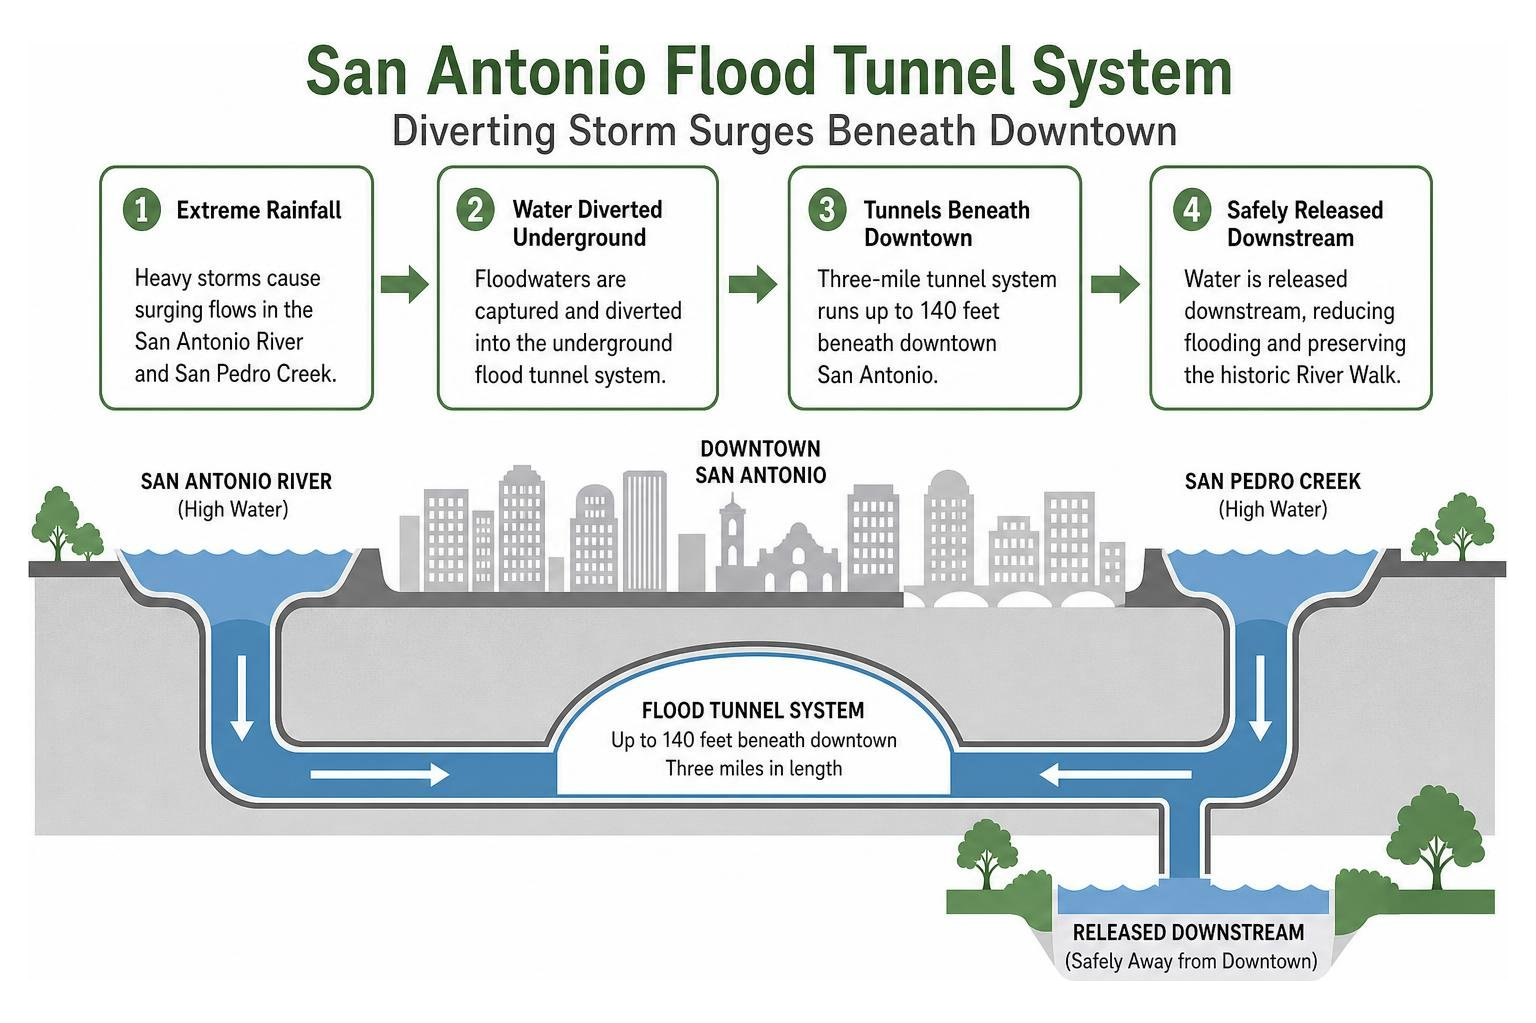
The cornerstone of San Antonio’s flood defense is the Olmos Dam, completed in 1927 to detain floodwaters from Olmos Creek before they reach downtown. In the late 20th century, the city constructed a three-mile underground flood tunnel system, running up to 140 feet beneath downtown. This system diverts surging floodwaters from the San Antonio River and San Pedro Creek, safely releasing them downstream and preserving the historic River Walk.
Real-Time Alert Technologies and Roadway Sensors
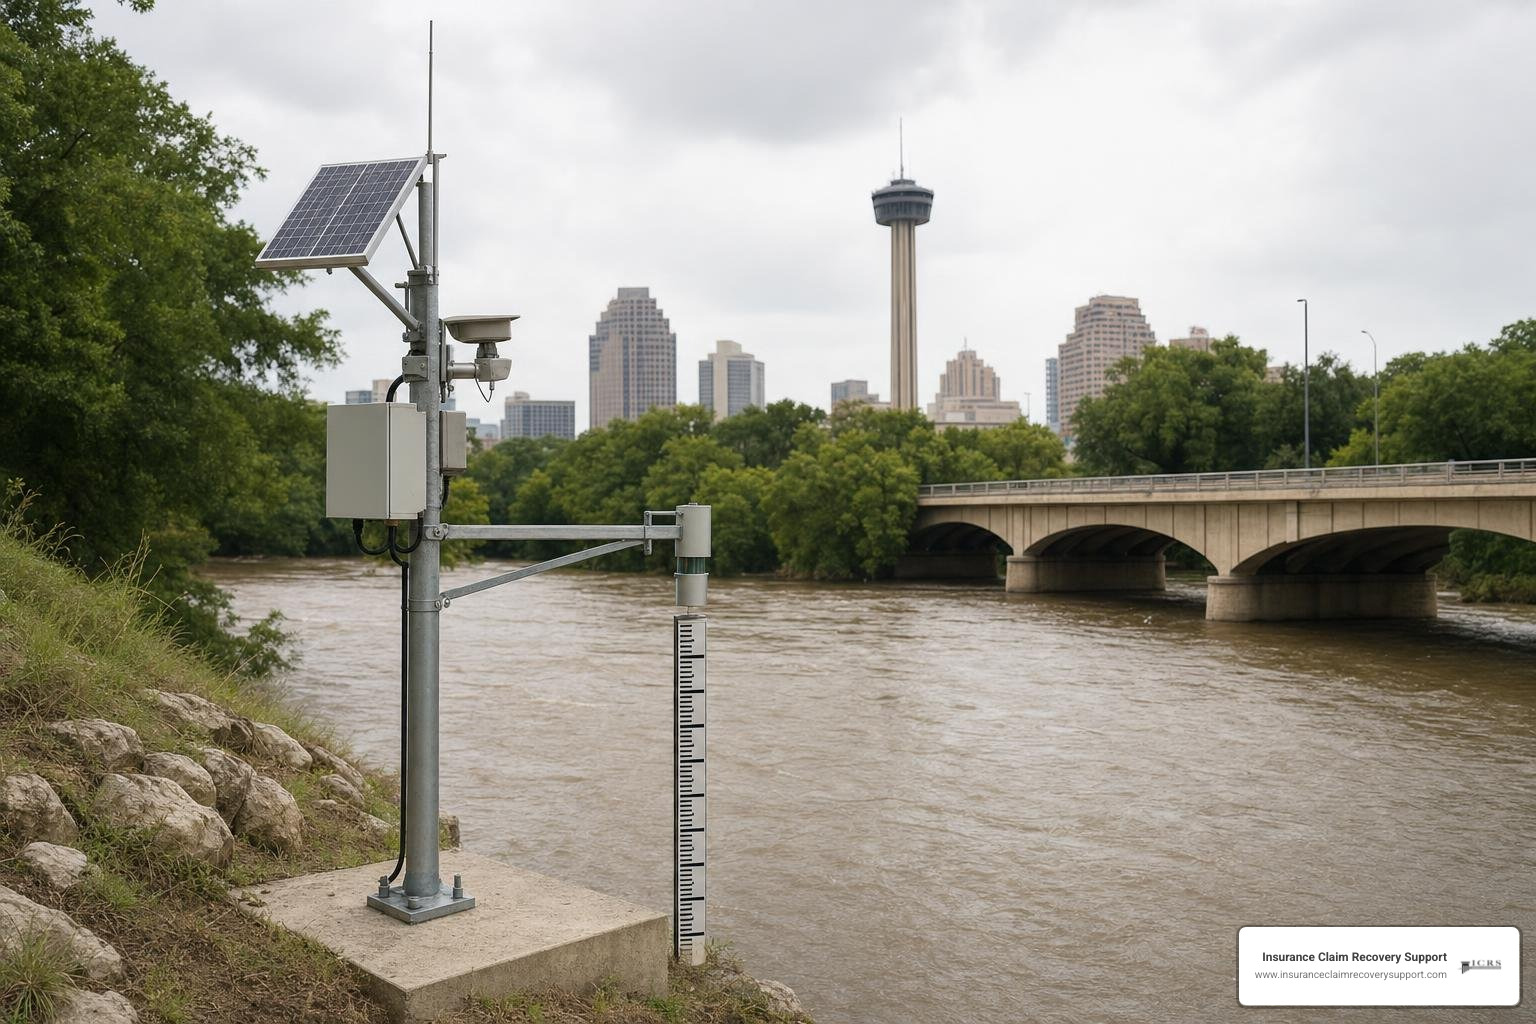
To safeguard drivers and local properties, the San Antonio River Authority operates over 200 High Water Alert Lifesaving Technology (HALT) sensors throughout the watershed. These real-time units monitor rising creek levels and trigger flashing warning lights, automated gates, and alerts on municipal portals like SARiverFlood.org.
Property owners and facility managers should integrate these warning networks into operational safety plans, following established protocols outlined in our guide to flood safety in San Antonio.
Financial and Insurance Realities of San Antonio Floods
Many commercial building owners and multifamily operators mistakenly assume their standard commercial property insurance policy covers rising water. In reality, standard property policies virtually always exclude surface water runoff, creek overflows, and general flood inundation.
Commercial properties require specialized flood coverage through the National Flood Insurance Program (NFIP) or private commercial excess flood markets. While NFIP commercial policies max out at $500,000 for building structures and $500,000 for contents, large commercial assets require comprehensive private excess flood policies to match true replacement costs.
For facilities facing complex water intrusion after heavy storms, following sound flood damage recovery procedures and using the practical educational resources at the Water Claim Guide helps maintain claim integrity.
When managing recovery efforts, proper containment and flood cleanup are essential steps toward stabilizing the building and meeting policy obligations outlined in a comprehensive property damage claims guide.
Navigating Zone X and Special Flood Hazard Areas
A frequent point of confusion for property investors is flood zone classification. Properties inside Special Flood Hazard Areas (Zones A, AE) are required by federally backed lenders to carry flood insurance. However, properties in Zone X (unshaded or shaded) still face real exposure from localized stormwater backup.
Because over 20 percent of all flood claims originate in low-to-moderate risk zones, securing commercial flood endorsements across all assets in Flash Flood Alley is a prudent risk-management strategy.
Commercial and Multifamily Property Claim Complexities
When severe storms inundate large commercial facilities or multifamily communities, the financial losses extend far beyond simple carpet drying. Large-loss flood claims frequently involve:
- Complex sub-slab structural settling and foundation movement.
- Contaminated black-water extraction and hazardous material remediation.
- Business interruption and extended loss of commercial rents.
- Mandatory building code upgrades and local floodplain compliance elevations.
For commercial and multifamily policyholders, large flood claims can involve questions about causation, covered damage, documentation, and policy conditions. Careful records of water entry points, damaged materials, mitigation work, and business-interruption impacts can help support a complete claim presentation. A dedicated public insurance adjuster for flood damage can help policyholders evaluate documentation and policy issues; claim results depend on the policy, damage, evidence, and circumstances.
Frequently Asked Questions About San Antonio Flood Frequency
What is the deadliest flood in San Antonio history?
The deadliest flood in San Antonio’s recorded history occurred on September 9–10, 1921, when over 17 inches of rain submerged downtown under 10 feet of water, claiming at least 224 lives. In modern history, the June 12, 2025 flash flood stands as the deadliest single-day event, causing 13 fatalities.
Does standard commercial property insurance cover flood damage in San Antonio?
No. Standard commercial property and business owner policies explicitly exclude damage caused by rising surface water, overflowing rivers, or flash flood inundation. Policyholders must purchase separate NFIP flood policies or private commercial flood endorsements to protect against these losses.
How many times a year does it flood in San Antonio?
According to FEMA’s National Risk Index, San Antonio averages 7.46 flood events per year across the metro area. While major regional disasters occur every 5 to 10 years, localized street and creek flooding happens multiple times annually during peak spring and autumn storm seasons.
Conclusion
Flooding in San Antonio is an undeniable geographical reality driven by the Balcones Escarpment, shallow soils, and intense precipitation patterns. For commercial property owners and multifamily operators, understanding local flood frequency is the first step toward effective risk management and disaster readiness.
When catastrophic storm or fire damage occurs, navigating large-loss insurance claims requires professional expertise. Insurance Claim Recovery Support LLC represents policyholders exclusively, advocating for commercial building owners, multifamily investors, HOAs, and industrial operators to document damage comprehensively and secure fair claim resolutions.
For qualifying large property claims of $250,000 or more after deductible, our team of licensed public adjusters provides dedicated representation throughout the claim process. For claims under $250,000, Claim Navigator provides paid strategic guidance with the option for full representation when appropriate. If your property has sustained major storm inundation or water loss, contact our team for dedicated claim help. Call anytime—our trained insurance claim AI assistant is available 24/7 to answer claim questions, share helpful resources, and collect information for our team. A team member will follow up during business hours.